 Benchmarking
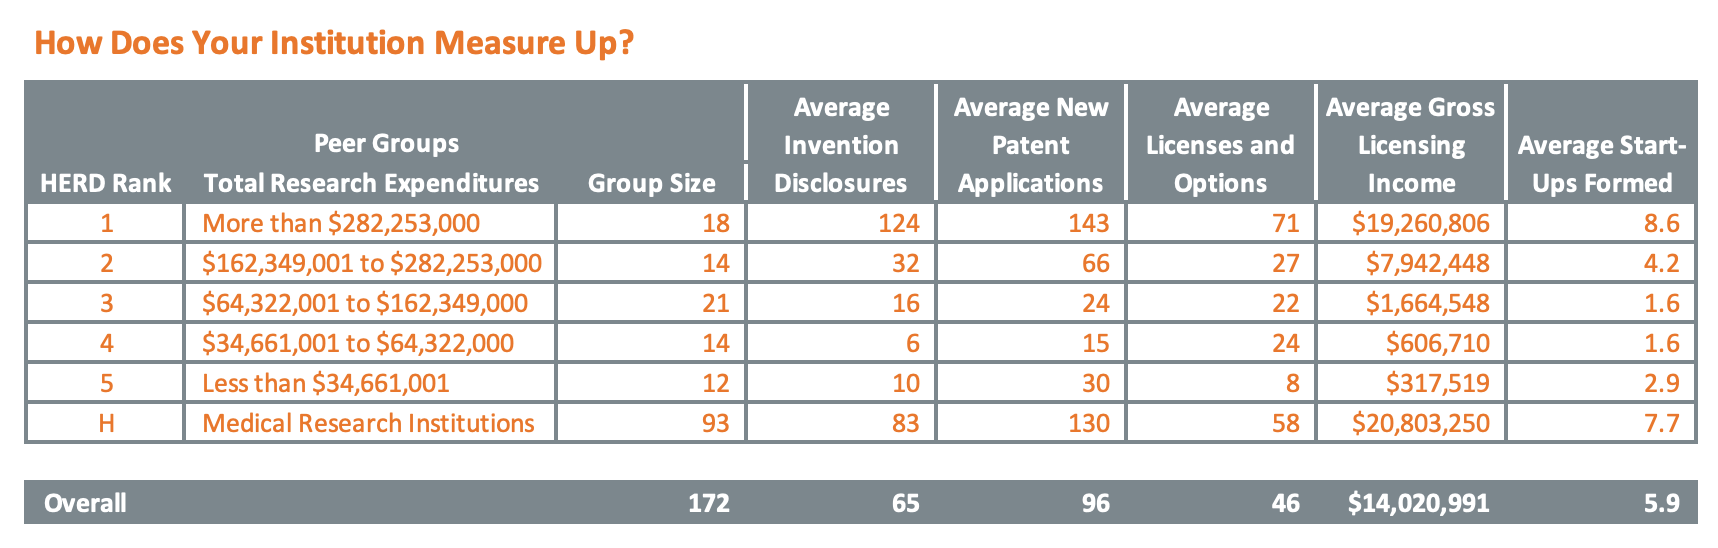
How Does Your Institution Measure Up?
We know that survey contributors already use the historical data to see how their institutions stack up. So using research expenditures to level the playing field, we’re taking a closer look at how tech transfer operations tick for different peer groups.
What to Measure
For the benchmarking report, we selected five of the most common measurements that broadly capture the overall performance of tech transfer offices. A sixth key measurement, research expenditures,was used to organize the data into peer groups.
- Invention Disclosures
- New Patent Applications
- Licenses and Options
- Gross Licensing Income
- Start-Ups Formed
Selecting Peer Groups
Another important consideration in cross-institution benchmarking is identifying appropriate peers. We use the HERD report to divide the population into categories based on research funding. Each year the National Science Foundation (NSF) conducts the comprehensive Higher Education Research and Development (HERD) Survey. This annual census collects information on R&D expenditures from more than 900 degree-granting institutions that spent at least $150,000 in R&D during the fiscal year. These institutions accounted for more than 99% of the total R&D expenditures reported.